TROY, MI 9/7/2021 –
By C. Michael Carty
A recent advance in investment decision-assistance technology promises to reduce the conflicts of interest targeted by new regulations and judicial rulings, mitigate increasing compliance cost pressures, and better match consumers’ investment preferences. The process and its applications are described with a critical view towards evaluating its efficacy in this new regulatory, competitive, and economic environment.
I. Background
There is a growing need to empower investors of all types, individuals and institutions alike, with the ability to comparatively evaluate the thousands of investment choices in order to select those that best satisfy their specific individual needs, goals, and preferences. Too many advisors limit their clients’ investment choices based on their compensation and not those best for the client. Recently, a process has been designed to enable these investors to obtain a definitive answer to the question, “Of all the available choices, which one is best for my client?”
Currently there are over 25,000 mutual funds1 and share classes, 5,000 to 6,000 separate account managers, and thousands of other financial products. Having too many choices and too much information about them, with no way to identify the “best” selection is the functional equivalent of having no information at all. In the absence of such a capability, investors have been entirely dependent on vendors of funds and advisory services, “professionals”, with no way to independently “vet” the recommendations they are given.
A patented process2 newly offered by Decision Technologies Corporation promises to enable investors of all types to select various relevant performance parameters, hierarchically arrange and weight them to score and rank all qualified choices. This produces the following desired effects:
It cuts through all of the “noise” in the market produced by advertising and marketing materials of the competing vendors;
It filters out all of the behind the scenes relationships, deals, and compensatory arrangements; e., all conflicts of interest; and
It enables investors to use relevant performance and other data on all available choices to identify those that most closely satisfy their needs; i.e., those that have proven best at producing the desired composite blend of investment results over
Advisors and fiduciaries are often called upon to choose from a limited number of alternatives without knowing all that are available. In such situations, the fiduciary is typically powerless to independently “vet” the few recommendations provided to them which are seldom the “best” and quite often a “subpar” choice.
The vendor-dominated financial services industry takes advantage of this inability of investors to comparatively evaluate all available choices for themselves in the sale of their products, often to the disadvantage of an uninformed public. This new decision technology-based process helps responsible advisors and clients make more informed and objective decisions for the exclusive benefit of the client, thereby ensuring that applicable standards of “fiduciary duty” can be and have been met.
II. The evolving market for investment services
Adoption of New Standards of Fiduciary Duty
New standards of fiduciary duty are evolving as the market for investment services grows in complexity and size. The role of the fiduciary must adapt to new laws, regulations, and judicial rulings defining the role of a fiduciary. This requires embracing a new fiduciary model based on new methods, new processes and new technologies.
Trustees’ duties under trust law dating to the 19th century were relatively simple; requiring a continuing duty to monitor investments and remove imprudent ones, separate and apart from exercising prudence in selecting investments. Later, the Investment Advisors Act of 1940 (“’40 Act”)3 extended those duties by requiring conflicts of interest to be disclosed and avoided. More recently, the Employee Retirement Income Security Act of 1974 (“ERISA”)4 added the requirement that most conflicts of interest be eliminated. If they are not, conflicted advice is only allowed through a prohibited transaction exemption.
In April 2016, the U.S. Department of Labor (“DOL”) introduced the Conflict of Interest Rule,5 popularly referred to as the “fiduciary rule.” It is intended to protect investors by requiring all who provide investment advice to retirement plans to abide by a “fiduciary” standard that puts their customers’ best interests before their own profits. Compliance with the rule was delayed until June 9, 2017. Certain exemptions from the rule, the Best Interest Contract Exemption (“BICE”),6 will be phased in effective January 1, 2018.
DOL’s fiduciary rule broadens the definition of a fiduciary to anyone who receives direct or indirect compensation for providing advice intended to result in action. It also requires that such compensation be “reasonable,” but without defining the standard for what constitutes “reasonable.” Without a meaningful definition, any method of compensation can be questioned. For example, is a onetime upfront 3.5% commission preferable to a level 0.75% annual fee? If the investment is held for 5 years or more the former is less costly.
The dilemma lies in determining a reasonable level compensation for fiduciaries which is also in the best interests of the client. The rule’s impending enforcement has had its critics call for it to be vacated or at least delayed in implementation.7 Its future, however, depends largely upon the new Trump administration. President Trump has yet given no indication of his position or its priority.8
Regardless of the new administration’s position, recent judicial decisions have ruled against delaying the fiduciary rule’s implementation. On August 25, 2016, in U.S. District Court (D.C.) Judge Randolph Moss ruled against enjoining the rule because it would delay protecting retirement investors from conflicted advice and potential losses to their retirement savings.9 On November 28, 2016, in U.S. District Court (Kansas) Judge Daniel Crabtree upheld the earlier court’s ruling that the plaintiff, an insurance company, was not entitled to injunctive relief because they did not prove that the DOL failed to follow appropriate procedures by putting fixed annuities under BICE. The Court also ruled that it “need not question whether the rule is improper because it imposes significant challenges to the plaintiff’s business model.”10
In a precedent setting case, Tibble v. Edison,11 beneficiaries of the Edison 401(k) Savings Plan (“Plan”) sued Edison International (“Edison”) and the Plan’s fiduciaries, to recover damages for losses suffered from breaches of their fiduciary duties. The plaintiffs argued that Edison acted imprudently by offering higher priced retail-class mutual funds as Plan investments when materially identical lower priced institutional- class mutual funds were available. U.S. District Court (Central California) Judge Stephen Wilson noted that the defendant had “not offered any credible explanation” for including the higher priced mutual funds costing the Plan to incur wholly unnecessary fees.12 He concluded that with respect to those mutual funds the defendants failed to exercise their fiduciary responsibility.
The defendants further claimed that their investment selection process was reasonable and thorough because they relied on the advice of the Plan’s single investment consultant, Hewitt Financial Services, regarding which mutual fund share classes should be selected for the Plan. Their expert witness stated that the Plan’s fiduciaries did not have access to information about different share classes and that their reliance on the consultant’s advice was therefore reasonable. The Court however reasoned that reliance on a single consultant’s advice was “an incomplete defense to a charge of imprudence.” Judge Wilson went on to say: “At the very least, Plan fiduciaries must ‘make certain that reliance on the expert’s advice is reasonably justified,’” The Court could not conclude that reliance on the expert’s advice, whatever it might have been, was reasonable. It therefore awarded damages to the plaintiffs.13
The District Court’s ruling was unanimously upheld by the U.S. Supreme Court14 in 2014. It ruled “that respondents violated their fiduciary duties with respect to three mutual funds added to the Plan in 1999 and three mutual funds added to the Plan in 2002.” Further they “acted imprudently by offering six higher priced retail-class mutual funds when materially lower priced institutional-class mutual funds were available.” With respect to those mutual funds, the respondents had failed to exercise “the care, skill, prudence and diligence under the circumstances that ERISA demands of fiduciaries.”
In sum, DOL’s fiduciary rule, the D.C. and Kansas District Courts’ rulings, and the Tibble v. Edison decision being upheld by the U.S. Supreme Court have redefined fiduciary duties. Fiduciaries, including plan sponsors, now have an affirmative ongoing duty to prudently select investments, monitor their performance, and dispose of imprudent ones. They must also disclose and eliminate any conflicts of interest while putting their customers’ best interests before their own profits. Moreover, the responsibility to discharge these duties is not mitigated by reliance on the advice of a single investment consultant or advisor, with no reasonable way to independently “vet” the advice or recommendations they are providing. Importantly, this newly defined role applies to anyone who receives direct or indirect compensation for providing advice intended to result in action, i.e., trustees, directors, brokers, insurance agents, investment advisors, financial planners, etc. Former methods for discharging these duties are inadequate and new methods must be adopted.
Competitive Cost Pressures
Simultaneously with changes in the regulatory environment, changes in investor preferences and competition are putting pressure on fees. Investors are increasingly unwilling to pay for underperforming investments. Research conducted by Vanguard using Morningstar data ending June 30, 2015 found, “Over the past 20 years, only 27% of actively managed U.S. equity mutual funds outpaced their prospectus benchmarks.”15 Active managers, on average, cannot outperform passive benchmarks such as the S&P 500 or Russell 2000 due, in part, to their greater turnover rates and higher transaction costs.
Investors know that one of the best ways to build assets for retirement, or for any other purpose over the long run, is to minimize investment costs. The easiest way to accomplish this is to invest in low-cost passive index funds. Statistics compiled by the Investment Company Institute (“ICI”) strikingly illustrate the pronounced trend towards investing in passive exchange-traded funds and away from actively managed mutual funds. In the five years from 2010 and 2015, the total net assets in domestic mutual funds grew to $6,046 billion from $4,053 billion, at an annual rate of 8.3%.16 In comparison, domestic index mutual funds grew to $14.9 billion from $7.0 billion, at an annual rate of 16.2%.17
While the better relative investment performance of indexed ETFs explains part of their impressive growth, their lower expense ratios are a significant contributing factor. In 2015, the average expense ratio for an indexed equity fund was 11 basis points vs. 84 basis points for the active equity fund, a difference of 74 basis points.18 This represents a considerable difference if one considers what an annual saving of 74 basis points can mean to investment performance over the long run.
The ICI’s statistics also indicate that by 2015 expense ratios for indexed funds dropped to 11 basis points from 27 basis points in 2000, a total reduction of 59.3%. This compares favorably against active funds’ expense ratios which dropped to 84 basis points in 2015 from 106 basis points in 2000, a drop of only 20.8%. The active funds’ higher expense ratios and smaller decline in response to competition from index funds is likely due to the higher costs of operating those funds but without tangible investment benefits.
On December 1, 2016, Labor Assistant Secretary Phyllis Borzi, the principal architect of DOL’s fiduciary regulation, addressed the Consumer Federation of America Conference stating it has already led to “low-cost, transparent investments for retail accounts” and will continue to do so.19 Ms. Brozi also cited announcements by several wirehouses and independent broker-dealers that they will no longer offer commission-based products in retirement accounts. If internal support for commission-based products is thought to be too costly or the potential liability too high, they will eventually no longer be provided. If so, low-cost transparent products must be created to replace them.
Changing Demographics
New and future products must be designed to reflect investors’ changing demographics and technological preferences. In mid-2015, 91% of U.S. households owning mutual funds had internet access, up from 68% in 2000.20 Internet access traditionally has been greatest among younger people, in both mutual fund–owning households and the general population, and the gap is only slowly narrowing among older households.
Digital advice is especially appealing to younger Generation X and Millennial investors who tend to be more technically sophisticated and more financial services wary than the older Baby Boomer generation. The new wave of internet applications permits banking and brokerage transactions, financial planning, risk preference questionnaires and asset allocation advice, and up-the-minute investment news. The automated nature of these services makes them both inexpensive and timely. Those navigating them are empowered to perform much of their own research and analysis, increasing their confidence in making their own decisions. This trend is expected to continue, with the greatest wealth transfer in human history over the next 30 years of an estimated $30 trillion from Baby Boomers to their Gen X and Millennial survivors.21
The Future of Advice a study by A.T. Kearney (2016),22 found two-thirds of mass affluent investors don’t know how much they pay for investment advice. On average, 72% of those who do know are willing to switch for lower fees. Of those under 35 years old, 90% are willing to switch for lower fees. Those who switch to providers for lower fees will most likely embrace digital solutions.
III. Business practices targeted by the new regulations
New regulations and judicial rulings promise to reduce conflicts of interest, result in better matching of consumers’ investment preferences, increase compliance cost pressures, and ensure fees are reasonable. They have also expanded the definition of a fiduciary to include anyone who offers advice and receives direct or indirect compensation. This is having a direct and significant impact on the way business will be conducted.
Retirement plan sponsors must now be more proactive in overseeing their retirement programs; advisors now have the burden of proving their advice is prudent and suitable; and broker-dealer supervisors need to identify and eliminate any conflicts of interest when their brokers offer expensive products or strategies. Clients’ best interests must be served above those of fiduciaries’.
Most of these new requirements are rooted in past practices. Acting according to the doctrines of prudence, loyalty and suitability is standard practice. Disclosing and eliminating conflicts of interest is also not new. But, now a fiduciary must act in the client’s best interest or obtain exemptive relief under BICE.
These new regulations further imply that lower costs for investment products and services are in clients’ best interests. Reducing advisory fees to investors saving for retirement is clearly the intent of DOL’s regulation. The Kansas and DC District Court rulings support that intent. Moreover, Tibble v. Edison demonstrates the militancy with which investors will seek to recover losses from excessive fees. These events have caused a legal realignment in favor of customers purchasing investment products or services and away from those who might improperly profit from them.
Fiduciaries must now provide informed, justifiable advice at a reasonable cost. This requires using decision-oriented processes which are objective, all inclusive, analytically sound, relevant, and cost-effective.
IV. Investment Technology will play a major role
For responsible fiduciaries, the task of overseeing or offering investment advice has grown in both magnitude and complexity. How can one convincingly argue that what is being offered is in the best interest of a client if they haven’t investigated all other options, risks and costs?
Businesses creating financial products must now offer a sufficiently large variety of choices to satisfy numerous client demands at “reasonable” prices. This has contributed to the growth of the fintech industry, one form of which are robo-advisors. Robo- advisors offer automated, low-cost, investment advisory services through web-based and/or mobile platforms. They offer fully digital investment management services which provide automated, diversified, and mostly ETF portfolios to mainly mass affluent customers at low-cost. A robo-advisory services study23 conducted by A. T. Kearney in 2015 estimated their assets under management will reach over $2 trillion by 2020, growing at 68% annually. Since the low fees charged by robo-advisors are typically a fraction of those charged by a full-service advisor, they are presumably in their customers’ best interests.
A second but no less important form of the fintech industry is becoming known as the decision-assistance advisor. DTC’s patented process provides plan sponsors and other fiduciaries with a uniquely flexible framework for scoring and ranking investment universes or subgroups using customized, weighted blends of performance criteria specific to each given application to ensure offered choices are in the client’s best interest.
Other firms offering information to facilitate investment decisions, e.g., Morningstar, Standard and Poor’s, and Value Line, partition investments into groups according to fixed criteria, a “one-size-fits-all approach” without regards to the individual needs, goals, and preferences of the individual user, While placing investments into groups is intended to distinguish between the investment performance of high and low ranked groups, it doesn’t identify the best performing investments within a group. Furthermore, a group ranking doesn’t indicate whether an investment is moving up or down within the group from one period to the next.
V. Applying decision-assistance technology to mutual fund selection
DTCs’ process quantifies the relative attractiveness of investments in a variety of asset classes; i.e., separately managed accounts, mutual funds, fixed annuities, etc.
Analyzing an asset class, such as large cap mutual funds, requires the following steps.24
Choosing a representative universe to include all investible large cap mutual
Filtering out investments that do not belong, such as funds that do not describe themselves as large cap, or are not open to new investment, or do not comply to standards set by the Association of for Investment Management and Research (“AIMIR”).
Selecting relevant performance parameters characteristic of previously successful investments; g., 1-, 3-, and 5-year annual returns or standard deviations.
Weighting the parameters to emulate successful composite performance in the asset class; e.g., return might be given a 60% weight and risk the remaining 40%. These weights could be determined heuristically or statistically depending on the
Scoring all investments and a relevant benchmark index contained in the filtered
Ranking the investments from the highest to the lowest
Reviewing the results by comparing the composite scores of the current holdings with those of the leading funds or a relevant
Deciding on one or more appropriate actions; replacing a current holding with an apparently superior fund, putting a current holding on the “watch list,” or conducting further research.
And most importantly, implementing appropriate
As with most quantitative studies, historical values of the parameters are used. Although past performance of a single investment is no guarantee of its future performance, superior future performers can usually be found among a large diversified group of previously successful investments.
To illustrate the process, a universe of large cap mutual funds is chosen. Other asset classes could also have been chosen to vet the process, e.g., separately managed accounts, mid or small cap funds, fixed income or variable annuity subaccounts.
Assume a case in which a plan fiduciary wishes to review large cap mutual funds to add more promising funds and dispose of less promising holdings. Exhibit 1 illustrates one possible set of Risk and Return components, their selected parameters and weights for analyzing large cap mutual funds in November 2016
Exhibit 1. Parameters and Weights Relevant to the Large Cap Funds’ Composite Scores
Source: Decision Technologies Corporation
As shown in Exhibit 1, Risk is given 40% of the overall weight in analyzing the funds and Return the remaining 60%. The 3 parameters used to construct the Risk component are: the average standard deviations over 1-year (10%), 3-years (25%) and 5-years (65%). The 3 parameters used to construct the Return component are: the average returns for 1-year (10%), 3-years (25%) and 5-years (65%). Using these weights, the score for each fund is computed and ranked in descending order.
To restrict the analysis to purely large cap funds, additional filters are imposed. Excluded are funds that do not describe themselves as large cap blend, growth or value, or are not AIMR compliant and not open to new investors. The resulting sample consists of 1,425 large cap mutual funds.
The top 10 scoring funds determined by DTC’s process are shown in Exhibit 2 along with the S&P 500 Index and the lowest scoring Morningstar 5 Star fund. The Sharpe ratios, though not used in the analysis, are shown for comparison against the composite scores. As one might expect, there appears to be a positive correlation between the composite scores and Sharpe ratios.
Exhibit 2. The Top 10 Large Cap Funds, Composite Scores, the S&P 500, Morningstar Ratings and Sharpe Ratios
| | | | | 5 year |
Rank | Large Cap Mutual Funds | Score | Stars | Sharpe |
| | | | | Ratio |
1 | Parnassus Endeavor Inv. | 8.57 | 5 | 1.61 |
2 | JNL/S&P Div. Inc. & Gro. | 7.95 | 5 | 1.66 |
3 | First Trust Value Line Div. | 7.91 | 5 | 1.62 |
4 | PowerShares S&P 500 Qty | 7.84 | 5 | 1.65 |
5 | SEI Dynamic Allocation | 7.84 | 5 | 1.65 |
6 | Amer. Beacon Bridgeway | 7.83 | 5 | 1.55 |
7 | SEI US Managed. Volatility | 7.82 | 5 | 1.72 |
8 | Metro West AlphaTrak 500 | 7.78 | 5 | 1.51 |
9 | Clearbridge Lrg Cap Gro | 7.76 | 5 | 1.48 |
10 | Invesco Diversified Div | 7.67 | 5 | 1.69 |
– | – | – | – | – |
99 | S&P 500 Composite | 7.26 | N/A | 1.38 |
– | – | – | – | – |
648 | Fidelity OTC | 6.47 | 5 | 0.99 |
Source: Decision Technologies Corp. and Morningstar
Exhibit 3. Performance Elements of the Top 10 Large Cap Funds and S&P 500 for the Period Ending November 2016
| | 1 Yr | 3 Yrs | 5 Yrs | 1 Yr | 3 Yrs | 5 Yrs |
Rank | Large Cap Mutual Funds | Avg. | Avg. | Avg. | Std. | Std. | Std. |
| | Retn. | Retn. | Retn. | Dev. | Dev. | Dev. |
1 | Parnassus Endeavor Inv. | 17.55 | 14.61 | 18.48 | 14.79 | 11.94 | 11.42 |
2 | JNL/S&P Div. Inc. & Gro. | 15.50 | 10.67 | 15.06 | 9.28 | 8.93 | 9.02 |
3 | First Trust Value Line Div. | 15.41 | 11.74 | 14.51 | 8.47 | 9.07 | 8.87 |
4 | PowerShares S&P 500 Qty | 10.71 | 10.46 | 15.11 | 8.57 | 9.59 | 9.10 |
5 | SEI Dynamic Allocation | 7.68 | 11.59 | 15.15 | 10.00 | 10.22 | 9.11 |
6 | Amer. Beacon Bridgeway | 12.28 | 9.92 | 16.39 | 11.40 | 11.00 | 10.51 |
7 | SEI US Managed. Volatility | 10.07 | 10.22 | 14.47 | 8.31 | 8.44 | 8.36 |
8 | Metro West AlphaTrak 500 | 11.54 | 9.98 | 16.32 | 11.06 | 10.88 | 10.76 |
9 | Clearbridge Lrg Cap Gro | 5.02 | 10.92 | 16.60 | 10.92 | 11.23 | 11.18 |
10 | Invesco Diversified Div | 9.21 | 8.94 | 14.25 | 7.94 | 8.29 | 8.35 |
– | – | – | – | – | – | – | – |
99 | S&P 500 Composite | 8.06 | 9.07 | 14.45 | 10.52 | 10.77 | 10.36 |
– | – | – | – | – | – | – | – |
648 | Fidelity OTC | 2,89 | 10.90 | 15.83 | 19.85 | 16.26 | 15.8 |
Source: Decision Technologies Corporation
Five significant conclusions can be reached by examining the performance elements in Exhibit 3.
DTC’s scoring system provides a primary rule for adding, retaining or liquidating a Superior scored funds should, of course, be retained or added to a portfolio while lower scored funds be avoided or liquidated. Clearly superior funds are found above the S&P 500’s score, mediocre and poor performing funds below it.
98 funds score better than the S&P 500 benchmark based on average returns and standard deviations over 1-, 3- and 5-year periods. Clearly, a significant number of funds can be found among that number to outperform the S&P
Two of the top 10 funds fail to beat the S&P 500 over the 1-year period. SEI’s Dynamic Allocation Fund has a lower 1-year return, 7.68%, than the S&P 500’s 8,06%, but it also has an offsetting lower standard deviation which contributes to its higher composite score. The Clearbridge Large Cap Growth Fund’s 1-year return also falls short of the S&P 500’s, but with greater standard deviations over 1-, 3-, and 5-years suggesting the possibility of lower scores in the future unless performance
All top scoring funds outperform Fidelity’s OTC Fund over 1-year in both returns and standard deviations. The Fund’s 5-year return is superior to 5 of the top 10 funds, but its greater 1-, 3-, and 5-year standard deviations reduce it to the 648th
DTC’s process can identify Morningstar 5 Star rated funds with significantly poorer performance than the S&P 500. This raises two important questions. Would a plan sponsor be acting prudently by holding a 648th ranked fund even if it has a 5 Star rating but is scored well below the S&P 500? How credible would his defense be if he claimed the decision was “reasonable” based on the Fund’s 5 Star rating?
The scoring process also provides a secondary rule for monitoring funds likely to increase or decrease in rank. Simply by recording a fund’s change in rank from one period to the next, or over several periods, important trends can be observed. If a fund is moving up in rank, it merits further research into the causes. A new manager, better economic prospects, or changes in investors’ preferences might portend a continuation of those favorable trends. Alternatively, a fund with a persistent decline in rank should be cause for concern and merit further scrutiny.
The distribution curve in Exhibit 4 illustrates the relative scores of all managers and the S&P 500 Index (represented by the green triangle located at 99 on the horizontal axis). The highest scoring managers are in the upper right of the chart. The #1 scoring fund, Parnassus Endeavor is represented by the orange circle between the 8th and 9th scores on the vertical axis. Lower scoring managers are represented by the declining scores to the left. If the difference in score between two managers is substantial, it will produce a noticeable difference in their relative position on the curve. A relatively large difference in relative score may be more significant than the numerical difference in score in terms of evaluating two managers’ performances. For example, the numerical difference between the #1 and #648 ranked funds (1.61-0.99=0.62) masks the significant difference in their relative scores shown in Exhibit 4.
Exhibit 4. Distribution of Composite Scores
– Large Cap Funds
Source: Decision Technologies Corporation
The quantitative nature of the process provides plan sponsors, brokers, advisors, or individual investors with an objective and granular scoring and ranking system superior to the grouped ratings of other processes. Although all funds shown in Exhibits 2, 3 and 4 have Morningstar 5 Star ratings, not all have or deserve equal scores.
The City of Miami General and Sanitation Employees’ Retirement Trust held its monthly meeting in September 2016 during which its portfolio’s performance was reviewed. At that meeting, DTC’s process was used to assist in evaluating the relative performance of the Trust’s investment managers. The following exhibits are excerpts of publicly available information from the board meeting. Full information is contained in “Demonstration of the Process” on www.GESE.org.25
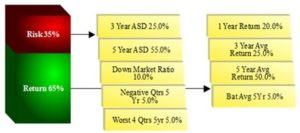
As seen in Exhibit 5, and previously in Exhibit 1, recent values of the Risk and Return parameters are more heavily weighed than those in the past. However, 3 new Risk parameters are introduced.31 The first, “Down Mkt 5yr,” is commonly called the “downside capture ratio.” It expresses a portfolio’s returns relative to its benchmark’s negative returns. A portfolio’s performance is superior to its benchmark if it has positive or less negative returns during periods when its benchmark has negative or zero returns. The second new Risk parameter is the number of negative quarters a portfolio has in the previous 5 years, an indication of its downside risk. The third Risk parameter is a portfolio’s return in the worst 4-trailing quarters of the last 5 years. In addition, a new Return parameter is introduced, the 5-year batting average which is simply the percent of quarters in which the portfolio achieved positive returns.
Exhibit 5. The Components, Parameters and Weights Relevant to the Composite Scores of Funds in the Trust
Source: Decision Technologies Corporation
Taken together, the 3 new Risk parameters combine measures which include the relative strength of a portfolio in a weak market, a possible persistence in its negative performance, and its worst returns over 4 trailing-quarters. In this sense, they provide a more comprehensive perspective than single static measures currently used in analyzing portfolio performance. For example, the Sharpe ratio26 measures the average return earned in excess of the risk-free rate per unit of standard deviation using strict assumptions imposed by Capital Asset Pricing Theory.27 The Sortino ratio,28 a variant of the Sharpe ratio, uses the standard deviation of a portfolio’s negative returns to assess its exposure to negative risk. Although each is often used as a standalone measure of return relative to risk, or negative risk, serious analysts would prefer using additional Risk parameters.
To restrict the analysis to funds purely in their asset class, additional filters are imposed. For example, the analysis of international large cap value equity requires funds be excluded that do not describe themselves as international equity, large cap, or value.
Likewise, filters used for the analysis of large cap growth funds would require that they describe themselves as large cap and growth. Funds that are not AIMR compliant or not open to new investors are also excluded.
An additional filter is imposed on the international large cap value asset class. It excludes funds having 5-year average standard deviations less than 11.09% or greater than 18.47%. This is intended to limit the scoring process to only those funds having volatility close to the average of the asset class. The resulting 49 funds therefore represent a more homogeneous group. Using the parameter weights shown in Exhibit 5, the score for each of the 49 funds is computed and ranked in descending order
Exhibit 6 contains the top 10 ranked international large cap value funds, the MSCI EAFE Index, and a 47th ranked fund, the Allianz Global Investors International Value Fund. This latter fund is included as one of the Trust’s holdings. Learning that the fund ranks 47th out of 49 funds is valuable information for the Trustees, and can only be uncovered by a scalar scoring rather than a group ranking process.
Exhibit 6. DTC’s Top 10 Top Scoring International Large Cap Value Funds, the MSCI EAFE Index and Composite Scores
Rank | Int’l Large Cap Value Funds | Comp |
| | | Score |
1 | Burgundy Asset: EAFE Equity | 9.71 |
2 | Pyrford Int’: European Equity | 8.20 |
3 | Federated Inv: Int StratVal ADR | 6.89 |
4 | Deleware Inv: ADR-London MA | 6.88 |
5 | Mondrian Invst: Focused IAQ | 6.86 |
6 | Boston Partners: BP Intl Equity | 6.66 |
7 | MFS Invt Mgmt: Japan Equity | 6.44 |
8 | Tocqueville: IMEC | 6.32 |
9 | Schaffer Cullen: Intl Hi Div ADR | 6.25 |
10 | Mondrian Inv: Foc ACWexUS | 6.07 |
– | – | – |
23 | MSCI EAFE Index | 4.75 |
– | – | – |
47 | AllianzGI INTL | 2.51 |
Source: Decision Technologies Corporation
As evident in Exhibit 7, the Allianz Global Investors International Value Fund has poorer average returns over 1-, 3-, and 5-years than the top 10 ranked funds and the MSCI EAFE Index. Its declining momentum is revealed by the contrast in its 5-year average return of -0.67% versus a 3-year average return of -3.88% and an even worse 1-year return of -15.14%. The significant difference between the Fund’s 1-year return and Burgundy Asset’s EAFE Equity Fund (the #1 ranked fund) is 21.53%, (6.39%+15.14%), which suggests a need for decisive action.
Exhibit 7. DTC’s Top 10 Ranked International Large Cap Value Funds, the MSCI EAFE, and Return Parameter Values
| | | | 3 Yrs | 5 Yrs | Bat |
Rank | Int’l Large Cap Value Funds | 1Yr | Avg | Avg | Avg |
| | | Retn | Retn | Retn | 5 yrs |
1 | Burgundy Asset: EAFE Equity | 6.39 | 8.59 | 10.58 | 80.00 |
2 | Pyrford Int’: European Equity | -1.38 | 5.19 | 6.74 | 55.00 |
3 | Federated Inv: Int StratVal ADR | -2.78 | 1.78 | 4.55 | 50.00 |
4 | Deleware Inv: ADR-London MA | -5.43 | 5.02 | 4.26 | 60.00 |
5 | Mondrian Invst: Focused IAQ | -6.36 | 5.48 | 4.78 | 60.00 |
6 | Boston Partners: BP Intl Equity | -4.95 | 5.55 | 6.34 | 70.00 |
7 | MFS Invt Mgmt: Japan Equity | -1.70 | 6.78 | 7.43 | 50.00 |
8 | Tocqueville: IMEC | -0.32 | 7.81 | 4.41 | 60.00 |
9 | Schaffer Cullen: Intl Hi Div ADR | -3.02 | 1.95 | 3.09 | 55.00 |
10 | Mondrian Inv: Foc ACWexUS | -6.68 | 2.64 | 3.04 | 45.00 |
– | – | | – | – | – |
23 | MSCI EAFE Index | -7.87 | 2.68 | 2.76 | 0.00 |
– | – | | – | – | – |
47 | AllianzGI INTL | -15.14 | -3.88 | -0.67 | 35.00 |
Source: Decision Technologies Corporation
Exhibit 8. DTC’s Top 10 Ranked International Large Cap Value Funds, the MSCI EAFE, and Risk Parameter Values
| | | 1 Yr | 3 Yrs | 5 Yrs | Down | Neg | |
Rank | Int’l Large Cap Value Funds | Std. | Std. | Std. | Mkt | Qtrs | Worst |
| | | Dev. | Dev. | Dev. | 5 Yrs | 5 Yrs | 4 Qtrs |
1 | Burgundy Asset: EAFE Equity | 10.24 | 8.58 | 11.38 | 49.03 | 5.00 | -1.86 |
2 | Pyrford Int’: European Equity | 6.92 | 8.97 | 11.12 | 58.62 | 5.00 | -4.80 |
3 | Federated Inv: Int StratVal ADR | 9.86 | 10.00 | 11.46 | 67.71 | 7.00 | -12.86 |
4 | Deleware Inv: ADR-London MA | 11.58 | 10.87 | 11.58 | 74.41 | 6.00 | -9.57 |
5 | Mondrian Invst: Focused IAQ | 11.89 | 11.02 | 11.89 | 74.42 | 6.00 | -9.95 |
6 | Boston Partners: BP Intl Equity | 11.47 | 11.58 | 13.75 | 83.17 | 6.00 | -9.36 |
7 | MFS Invt Mgmt: Japan Equity | 21.73 | 15.16 | 13.69 | 56.34 | 8.00 | -4.99 |
8 | Tocqueville: IMEC | 13.36 | 11.94 | 14.18 | 90.49 | 6.00 | -16.89 |
9 | Schaffer Cullen: Intl Hi Div ADR | 9.45 | 9.82 | 12.78 | 84.22 | 6.00 | -9.41 |
10 | Mondrian Inv: Foc ACWexUS | 12.85 | 10.61 | 12.12 | 82.66 | 7.00 | -10.26 |
– | – | – | – | – | – | – | – |
23 | MSCI EAFE Index | 12.72 | 11.85 | 14.78 | 100.00 | 7.00 | -13.38 |
– | – | – | – | – | – | – | – |
47 | AllianzGI INTL | 17.27 | 12.89 | 15.95 | 116.32 | 8.00 | -17.73 |
Source: Decision Technologies Corporation
Note that the huge “return premium” between the Burgundy Asset’s EAFE Equity Fund and Allianz’s International Fund is not accompanied by an equivalently large “risk premium” as shown in Exhibit 8. The #1 fund’s risk is lower in all 6 categories than the #47th fund. Had the top scoring fund been held instead of the 47th fund, the portfolio’s overall risk could have been significantly reduced. The distribution of composite scores in Exhibit 9 shows a steep drop in ranks from top to bottom. This is due to the wider range of values of the return-related parameters and their greater weight than risk-related parameters in the composite scores.
As pointed out earlier, in the discussion of Exhibit 4, if the difference in score between two funds is substantial, it will produce a noticeable difference in their relative position on the curve. A relatively large difference in relative score may be more significant than their numerical difference in evaluating two funds’ performances. Here, in Exhibit 9, the relatively large difference between the #1 ranked fund and the #47th is dramatic.
Exhibit 9. Distribution of Composite Scores
Source: Decision Technologies Corporation
Exhibit 10 illustrates the typical tendency of top scoring funds to bunch together. The difference between the scores of the first and tenth ranked large cap growth funds is quite small, 1.05; (8.73-7.68=1.05). Their scores are also significantly above their benchmark, the Russell 1000 Growth Index. Three of the Trust’s holdings, the Atlanta Capital Funds, highlighted in orange, scored well below the benchmark with relative ranks near the bottom of the sample, a reason to consider remedial action. Exhibit 10. The Top 10 Ranked Domestic Large Cap Growth Funds, Russell 1000 Growth Index, and Composite Scores
Rank | Large Cap Growth Funds | Comp |
| | | Score |
1 | Vontobel US Equity | 8.73 |
2 | CBI LM Retail: CB LCG ESG (MA) | 8.61 |
3 | Polen Capital: Polen Focus Grow | 8.43 |
4 | CBI LM Retail: CB LCG (MA) | 8.18 |
5 | HS Management Concentrated Gr | 8.18 |
6 | Loomis Sayles: Large Cap Grow | 8.02 |
7 | ClearBridge Inv: LCG | 7.97 |
8 | Boston Harbor: Select 40 | 7.70 |
9 | BMO Asset Mgt: Disciplined LCG | 7.69 |
10 | Pioneer Invest: Concent. Growth | 7.68 |
– | – | – |
58 | Russell 1000 Growth Index | 6.15 |
– | – | – |
176 | Atlanta Capital: HQ Gro Plus MA | 4.68 |
182 | Atlanta Capital: HQGP | 4.56 |
227 | Atlanta Capital: HQ Foc Growth | 3.45 |
Source: Decision Technologies Corporation
Exhibit 11. The Top 10 Ranked Domestic Large Cap Growth Funds, Russell 1000 Growth Index, and Return Parameter Values
| | | | 3 Yrs | 5 Yrs | Bat |
Rank | Large Cap Growth Funds | 1Yr | Avg | Avg | Avg |
| | | Retn | Retn | Retn | 5 yrs |
1 | Vontobel US Equity | 7.95 | 13.15 | 15.24 | 65.00 |
2 | CBI LM Retail: CB LCG ESG (MA) | 7.63 | 16.31 | 15.70 | 70.00 |
3 | Polen Capital: Polen Focus Grow | 11.78 | 16.63 | 14.91 | 55.00 |
4 | CBI LM Retail: CB LCG (MA) | 5.73 | 16.03 | 15.73 | 75.00 |
5 | HS Management Concentrated Gr | 3.19 | 12.72 | 15.81 | 55.00 |
6 | Loomis Sayles: Large Cap Grow | 7.11 | 15.43 | 15.02 | 55.00 |
7 | ClearBridge Inv: LCG | 5.81 | 16.02 | 15.42 | 65.00 |
8 | Boston Harbor: Select 40 | 5.56 | 11.84 | 14.51 | 50.00 |
9 | BMO Asset Mgt: Disciplined LCG | 3.89 | 15.82 | 14.67 | 70.00 |
10 | Pioneer Invest: Concent. Growth | 4.94 | 15.02 | 14.42 | 55.00 |
– | – | – | – | – | – |
58 | Russell 1000 Growth Index | 2.52 | 13.61 | 12.38 | 0.00 |
– | – | – | – | – | – |
176 | Atlanta Capital: HQ Gro Plus MA | 2.07 | 11.25 | 9.62 | 40.00 |
182 | Atlanta Capital: HQGP | 1.91 | 11.27 | 9.57 | 40.00 |
227 | Atlanta Capital: HQ Foc Growth | 2.29 | 11.09 | 8.44 | 45.00 |
Source: Decision Technologies Corporation
As evident in Exhibit 11, the Atlanta Capital Funds’ poor scores and ranks are attributable to their poorer 1-, 3- and 5-year returns relative to the top 10 ranked funds as well as the Russell 1000 Growth Index. The Return parameters’ values for all 3 funds are well below those of the top 10 funds. Moreover, as illustrated in Exhibit 12, their Risk parameter values were also deficient in comparison to the leaders, with greater 3- and 5-year standard deviations.
Exhibit 12. The Top 10 Ranked Domestic Large Cap Growth Funds, Russell 1000 Growth Index, and Risk Parameter Values
| | | 1 Yr | 3 Yrs | 5 Yrs | Down | Neg | |
Rank | Large Cap Growth Funds | Std. | Std. | Std. | Mkt | Qtrs | Worst |
| | | Dev. | Dev. | Dev. | 5 Yrs | 5 Yrs | 4 Qtrs |
1 | Vontobel US Equity | 8.37 | 7.25 | 9.65 | 40.48 | 4.00 | 7.70 |
2 | CBI LM Retail: CB LCG ESG (MA) | 9.51 | 7.40 | 12.12 | 78.16 | 4.00 | 5.74 |
3 | Polen Capital: Polen Focus Grow | 7.24 | 8.56 | 12.25 | 68.94 | 4.00 | 2.82 |
4 | CBI LM Retail: CB LCG (MA) | 11.01 | 8.37 | 12.74 | 83.25 | 4.00 | 5.73 |
5 | HS Management Concentrated Gr | 5.45 | 7.04 | 11.60 | 52.63 | 2.00 | 3.19 |
6 | Loomis Sayles: Large Cap Grow | 11.43 | 9.25 | 11.66 | 60.72 | 5.00 | 4.43 |
7 | ClearBridge Inv: LCG | 10.73 | 8.34 | 13.02 | 85.38 | 4.00 | 5.44 |
8 | Boston Harbor: Select 40 | 9.28 | 7.04 | 11.07 | 47.62 | 4.00 | 2.57 |
9 | BMO Asset Mgt: Disciplined LCG | 9.47 | 8.96 | 12.49 | 83.80 | 4.00 | 3.89 |
10 | Pioneer Invest: Concent. Growth | 9.64 | 8.72 | 11.82 | 80.82 | 5.00 | 4.94 |
– | – | – | – | – | – | – | – |
58 | Russell 1000 Growth Index | 10.33 | 8.44 | 12.79 | 100.00 | 4.00 | 2.52 |
– | – | – | – | – | – | – | – |
176 | Atlanta Capital: HQ Gro Plus MA | 8.16 | 8.22 | 14.13 | 116.38 | 3.00 | -2.25 |
182 | Atlanta Capital: HQGP | 8.67 | 8.45 | 14.27 | 118.92 | 4.00 | -2.47 |
227 | Atlanta Capital: HQ Foc Growth | 10.42 | 9.63 | 16.16 | 134.50 | 6.00 | -5.78 |
Source: Decision Technologies Corporation
Exhibit 13 illustrates a noticeable difference in the relative positions of Atlanta Capital’s 3 funds and the top 10 ranked funds on the distribution curve. 2 of them, the HQ Growth Plus and HQGP Funds scored in the third quartile, and its HQ Focus Growth in the bottom quartile. Since scoring is based primarily on 1-, 3- and 5-year return and risk performances, their poor scores in Exhibit 10 and weak return and risk parameters in Exhibits 11 and 12 suggest all 3 have persistent performance problems requiring remedial action.
Exhibit 13. Distribution of Composite Scores
Source: Decision Technologies Corporation
Exhibit 14. Top 10 Ranked U.S. Intermediate Fixed Income Funds, Barclays U.S. Aggregate Bond Index, and Composite Scores
Rank | U.S. Intermediate Fixed Income | Comp |
| | | Score |
1 | Guggenheim Inv: Core Plus FI | 7.92 |
2 | Belle Haven: Taxable PLUS | 7.74 |
3 | Guggenheim Inv: Fixed Income | 7.72 |
4 | Dolan McEniry: DMC Core Plus | 7.63 |
5 | Templeton Finl: Inter Taxable Bd | 7.63 |
6 | Carnival Hill Inv: Core A or Better | 7.36 |
7 | Belle Haven: Tax Ladder PLUS | 7.31 |
8 | National Invest: Intermed PLUS | 7.30 |
9 | Karpus Inv Mgt: Fixed Inc. Mgt | 7.29 |
10 | Pioneer Invest: U.S. Core Fixed | 7.29 |
– | – | – |
217 | Chicago Equity: High Qual Interm | 6.13 |
– | – | – |
234 | Barclays U.S. Aggr. Bond Index | 6.04 |
Source: Decision Technologies Corporation
Exhibit 14 contains the top 10 ranked domestic U.S. intermediate fixed income funds. Since the performance of fixed income securities is determined for the most part by their maturity and relationship to the yield curve for U.S. government securities, the spread among the highest ranked funds is small, 0.63. The Plan’s holding, the Chicago Equity: High Quality Intermediate Bond Fund has a score of 6.13 which is 1.79 below the top ranked fund, and ranked 217th of over 250 funds. It is therefore possible to improve the Trust’s fixed income risk-adjusted performance with a higher scoring fund.
The Return component of the fixed income investments carry a weight of 60% in the composite score. Exhibit 15 contains the scores of the top 10 funds and the Trust’s 217th ranked fixed income holding. The top 10 funds have significantly higher returns than this fund over 3- and 5-years and, hence, their higher rank than Chicago Equity’s.
Exhibit 15. The Top 10 Ranked U.S. Intermediate Fixed Income Funds, Barclays U.S. Aggregate Bond Index, and Return Parameter Values
| | | | 3 Yrs | 5 Yrs | Bat |
Rank | U.S. Intermediate Fixed Income | 1Yr | Avg | Avg | Avg |
| | | Retn | Retn | Retn | 5 yrs |
1 | Guggenheim Inv: Core Plus FI | 1.70 | 4.43 | 6.67 | 70.00 |
2 | Belle Haven: Taxable PLUS | 4.45 | 4.23 | 5.76 | 90.00 |
3 | Guggenheim Inv: Fixed Income | 2.20 | 4.71 | 7.11 | 95.00 |
4 | Dolan McEniry: DMC Core Plus | 2.33 | 3.73 | 5.39 | 65.00 |
5 | Templeton Finl: Inter Taxable Bd | 5.75 | 4.69 | 6.25 | 90.00 |
6 | Carnival Hill Inv: Core A or Better | 2.25 | 3.52 | 4.90 | 55.00 |
7 | Belle Haven: Tax Ladder PLUS | 3.58 | 3.33 | 4.92 | 80.00 |
8 | National Invest: Intermed PLUS | 2.03 | 2.63 | 4.46 | 60.00 |
9 | Karpus Inv Mgt: Fixed Inc. Mgmt | 6.50 | 5.34 | 6.55 | 75.00 |
10 | Pioneer Invest: U.S. Core Fixed | 1.26 | 3.23 | 4.86 | 60.00 |
– | – | – | – | – | – |
217 | Chicago Equity: High Qual Interm | 2.35 | 1.50 | 2.85 | 25.00 |
– | – | – | – | – | – |
234 | Barclays U.S. Aggr. Bond Index | 1.96 | 2.50 | 3.78 | 0.00 |
Source: Decision Technologies Corporation
Exhibit 16. The Top 10 Ranked U.S. Intermediate Fixed Income Funds, Barclays U.S. Aggregate Bond Index, and Risk Parameter Values
| | | 1 Yr | 3 Yrs | 5 Yrs | Down | Neg | |
Rank | U.S. Intermediate Fixed Income | Std. | Std. | Std. | Mkt | Qtrs | Worst |
| | | Dev. | Dev. | Dev. | 5 Yrs | 5 Yrs | 4 Qtrs |
1 | Guggenheim Inv: Core Plus FI | 2.02 | 2.79 | 2.87 | -34.62 | 3.00 | 1.70 |
2 | Belle Haven: Taxable PLUS | 3.63 | 3.03 | 2.57 | 24.91 | 3.00 | 0.59 |
3 | Guggenheim Inv: Fixed Income | 3.46 | 3.49 | 3.31 | 33.26 | 3.00 | 0.92 |
4 | Dolan McEniry: DMC Core Plus | 3.04 | 2.53 | 2.35 | -39.73 | 4.00 | 1.59 |
5 | Templeton Finl: Inter Taxable Bd | 3.76 | 3.48 | 3.31 | 32.42 | 2.00 | -0.52 |
6 | Carnival Hill Inv: Core A or Better | 3.37 | 2.51 | 2.29 | 28.84 | 3.00 | 0.71 |
7 | Belle Haven: Tax Ladder PLUS | 2.99 | 2.79 | 2.57 | 38.08 | 3.00 | -0.37 |
8 | National Invest: Intermed PLUS | 2.24 | 2.18 | 2.12 | 15.85 | 3.00 | 0.72 |
9 | Karpus Inv Mgt: Fixed Inc. Mgmt | 5.40 | 4.55 | 3.80 | 34.42 | 3.00 | -2.52 |
10 | Pioneer Invest: U.S. Core Fixed | 2.50 | 2.60 | 2.41 | 10.56 | 2.00 | 0.76 |
– | – | – | – | – | – | – | – |
217 | Chicago Equity: High Qual Interm | 3.17 | 2.42 | 2.55 | 76.57 | 4.00 | -2.03 |
– | – | – | – | – | – | – | – |
234 | Barclays U.S. Aggr. Bond Index | 4.14 | 3.20 | 3.02 | 100.00 | 5.00 | 2.02 |
Source: Decision Technologies Corporation
One might expect that a fixed income fund with significantly lower returns than others in its asset class would also have significantly lower volatility. This, however, is not the case as shown in Exhibit 16. Chicago Equity’s average standard deviations are comparable to those of the top 10 scoring funds, lower than some and higher than others, but in proximity to all. It therefore has no discernable offsetting lower volatility.
Exhibit 17. Distribution of Composite Scores – International Intermediate Fixed Income Funds
Source: Decision Technologies Corporation
Exhibit 17 supports two relevant observations. First, it demonstrates the stark contrast between Chicago Equity’s relative rank and its entire asset class. Its mid-fourth quartile rank is so poor that the Trust’s performance will most likely be improved by simply replacing it. Second, it provides graphical evidence of the narrow differences in scores between the high and low ranked funds in this asset class. Highly scored and ranked investments are bunched together at the top of the distribution curve. Beyond that the curve enters a range of mediocre performance and then drops abruptly. This pattern is characteristic of intermediate fixed income investments and sharply contrasts the pattern of large cap growth investments found in Exhibit 13.
For a diversified portfolio to be efficient, it must not only consider the risk and return of its investments but also the pair-wise covariance between them. Scalar scoring within an asset class does not necessarily result in an optimal portfolio asset allocation. Its only objective is to efficiently distinguish between superior and inferior investments within an asset class.
Investments in an asset class should be highly correlated or they shouldn’t be included in that asset class. That is not to say, however, that the pair-wise lack of correlation between asset classes does not contribute to a portfolio’s optimality, i.e., efficiency. In fact, it does. A diversified portfolio of low-, negatively-, or un-correlated asset classes could, in fact, approach optimality if it holds the highest scoring investments in each asset class.
VII. Decision-assistance technology vs. performance measurement services
The role played by decision-assistance technology in the investment process sharply contrasts that played by conventional performance measurement services. It enables investors to identify the relative merits of qualified investments using customized performance parameters and proactively facilitates investment decisions.
By comparison, the role played by performance measurement services is limited to simply reporting the positions of current holdings relative to benchmark indexes within quartiles of their asset classes. It highlights poor performing investments, identifying situations that should be reviewed, but it does not offer choices and does little to define decisive courses of action.
Exhibit 18 is a typical performance report used by most consultants for several decades. It is taken from the “Investment Performance Analysis”34 commissioned by the City of Miami General & Sanitation Employees’ Retirement Trust. This analysis identifies the relative position of the Atlanta Capital HQ Growth Plus Fund’s total returns with respect to the Russell 1000 Growth Index and the quartiles of a large cap growth universe defined by the consultant. While the analysis correctly reports the relatively poor performance of Atlanta Capital’s total returns, it does little else. It completely ignores important parameters, e.g., volatility and drawdown, and fails to identify other more suitable investment choices.
Exhibit 18. Large Cap Growth Performance Comparisons
Source: Southeastern Advisory Services, Inc.
In contrast, the analyses contained in Exhibits 1, and 10 through 13 above provide a more comprehensive view of the investment process. Exhibit 1 identifies the relevant risk and return parameters, their weights, and relative importance in the composite scores. Exhibit 10 lists the top 10 scoring and ranked funds, the Russell 1000 Growth Index, and the 3 Atlanta Capital Funds. Exhibit 11 identifies the parameters contributing to the Return component and the values used in computing the composite scores.
Exhibit 12 identifies the Risk parameters and their values. And, finally, the distribution curve in Exhibit 13 compares the relative performance of the over 250 investments. The combined information in those exhibits support decisions to liquate, hold, or acquire more suitable investments based upon an informed knowledge of their scores, ranks, and risk/return parameters.29
VIII. Implications for the post-DOL fiduciary rule environment
Limited information coming from the new Trump Administration and Congress is casting doubt on the speed with which DOL’s fiduciary rule will be implemented. Nevertheless, investor demand for reform, recent judicial rulings, more cost-conscious consumers, growing pressure on retail fees, changing demographics, and technological advances have irrevocably altered the market for investment services.
All manner of fiduciaries, plan sponsors, advisors, broker/dealers, CPAs, and lawyers, etc., must embrace new technologies to dispense defendable, objective advice to comply with the new standards of fiduciary responsibility mandated by regulations and judicial rulings.
Fiduciaries using new technologies will enjoy a competitive advantage by providing superior investment advice which should lead to their customers’ investment success and satisfaction.
Competitive pricing pressures will require employing more cost-effective automated processes to remain profitable. Deferring problems related to growing labor costs, research, marketing, and operations will eventually hurt profitability. The solutions lie in adopting an adaptable, low-cost technology.
The time required to make and act on informed investment decisions will continue to be reduced through electronic market-making and high frequency trading. Successful fiduciaries will not only profit by reducing the time necessary to take decisive actions, but also by reducing the opportunity costs of failing to take them in a timely manner.
Prudent automated, low-cost retirement advice is available to a greater number of underfunded Baby Boomers through fintech providers such as DTC. These same providers will also offer automated financial advice to Millennials and Gen Xers.
IX. Summary and conclusions
The patented process offered by Decision Technologies Corporation has been analyzed with a critical view towards evaluating the efficacy of its applications in this new regulatory environment. It filters out irrelevant information, focuses on relevant information, and identifies investment choices that are most likely in an investor’s best interest and most closely satisfy their risk/return preferences.
In addition, DTC’s process promises to mitigate increasing compliance costs by providing solutions that reduce conflicts of interest between fiduciaries and their customers. New regulations and judicial rulings have increased compliance costs, the possibility punitive actions, and/or financial liabilities. By helping responsible advisors
and clients make informed and objective decisions for the exclusive benefit of the client, it ensures that applicable standards of “fiduciary duty” can be met
Changes in investor preferences are also putting pressure on fees. Investors are no longer willing to pay for underperforming investments. Most active fund managers consistently underperform passive investments causing investors to seek acceptable performance with low-cost index funds. Fiduciaries seeking to reaffirm their value must now employ a low-cost, comprehensive and theoretically sound process to identify investments likely to outperform their peers and benchmarks.
New regulations and judicial rulings have expanded the definition of a fiduciary to include anyone who offers advice and receives direct or indirect compensation. Those defined as fiduciaries must now be proactive in providing advice that is prudent and suitable without significant conflicts of interest. This requires using a decision-oriented process which is objective, inclusive, analytically sound, relevant, and cost-effective.
DTC’s decision-assistance process is evaluated to determine its efficacy in providing actionable decisions. Part of that evaluation consists of going step-by-step through the process and evaluating its claimed features: objectivity, relevance, flexibility, scalar sorts and ranks, discrimination, and decision orientation. This evaluation included reviewing large cap mutual funds and 3 additional asset classes in an existing retirement trust: international large cap value equities, domestic large cap growth equities, and domestic intermediate fixed income.
The process is determined to be objective based on the set of parameters and weights selected. It is also relevant to the extent the selected parameters are relevant. The process is flexible in permitting the use of different parameters and filters, although their selection implies some subjectivity. It provides three output forms; scalar scores, ranks and distribution graphs which differentiate high from low scored investments relative to appropriate benchmarks. The output therefore distinguishes between superior and inferior performing investments and clearly delineates the need, or lack thereof, for appropriate action.
In conclusion, this decision-assistance technology provides fiduciaries with six benefits:
It offers a justifiable defense against charges of imprudence.
It offers a complete view and therefore control over the investment process from the prudent selection of top ranked investments based on relevant criteria, to monitoring performance, and facilitating the liquidation of imprudent
It indicates when an investment is increasing or decreasing in attractiveness from one period to the
It permits creating customized templates containing proprietary performance criteria, weightings, defined investment datasets, and process
It can further refine the scores and ranks of other ranking and rating systems, g., Morningstar’s 5 star ratings, Standard & Poor’s, and Value Line’s.
It is a significant and productive departure from conventional performance measurement services which typically report the total returns of a portfolio’s holdings relative to a benchmark index and within quartiles of their asset
Endnotes
Investment Company Institute, 2016 Investment Company Fact Book. Washington, DC: ICI, 2016, 178.
Smith, Eric S., and Joseph Simko, Decision Assistance Platform Configured for Facilitating Financial Consulting Services. S. Patent Office, Patent No: US 7,711,633 B2. Washington, DC: USPO, May 4, 2010.
Securities and Exchange Commission, Investment Advisers Act of 1940, Section 206,
Washington, DC: SEC, 1940, p.27.
Department of Labor, Employee Benefits Security Administration, “Department of Labor Finalizes Rule to Address Conflicts of Interest in Retirement Advice, Saving Middle Class Families Billions of Dollars Every Year.” Washington, DC: DOL, April 8,
Department of Labor, Employee Benefits Security Administration, Final Rule. Federal Register/Vol. 81, No. 68/April 10, 2016/Rules and Regulations. Washington, DC: DOL, 20945.
Department of Labor, Employee Benefits Security Administration, Final Rule; extension of applicability date. Federal Register/Vol. 82, No. 66/April 7, 2017/Rules and Regulations. Washington, DC: DOL, p. 16902.
8 Schoeff, Mark Jr., “Trump stumps industry,” Investment News, January 16, 2017, pp. 3,19.
Schoeff, Mark , “Judge’s questions show inclination to uphold DOL fiduciary rule.” InvestmentNews, August 26,2017, p.3.
Schoeff, Mark , “Kansas judge again upholds DOL fiduciary rule,” InvestmentNews, Friday, February 17, 2017.
Tibble et al v. Edison International et al, Case 2:07-cv-05359-SVW-AGR Document 405 Filed 07/08/10 Page 1 of 82 Page ID #:16617.
Ibid, 64
Ibid, 56.
Supreme Court of the S., Tibble et al. v. Edison International et al, May 18, 2015,
1.
Wallick, Daniel. W. et al, “Keys to improving the odds of active management ” Valley Forge, PA: The Vanguard Group, October 2015, p.3.
Investment Company Institute, 2016 Investment Company Fact Book. Washington, DC: ICI, 2016, 174.
Ibid, p. 218.
Ibid, 97.
, Schoeff, Mark, , “Borzi: Labor’s rule already reducing fees.” InvestmentNews, December 6, 2016, p.2.
ICI Research Perspective, “Ownership of Mutual Funds, Shareholder Sentiment, and Use of the Internet, 2015,” ICI Research Perspective, 20-21.
Malito, Alessandra, “The great wealth transfer is coming, putting advisors at risk,” InvestmentNews, July 13,
Hedges, Bob et al, Future of Advice Study. New York, NY: T. Kearney, June 2016, pp.15-16.
Epperson, Teresa et al, Hype Reality: The Coming Waves of “Robo” Adoption.
New Yok, NY: A.T. Kearney, June 2015. p. 26.
CSSC Investment Advisory Services, “Demonstration of Process,” September 30, 2016, 12-20. Can be found at http://www.gese.org/09302016/CSSC.PDF
Ibid, pp. 2-11.
Sharpe, William F., “The Sharpe Ratio.” The Journal of Portfolio Management, Fall
CAPM assumptions include those of a freely competitive market including no commissions, no taxes, numerous investors with the equal access to securities, all having equal expectations and planning horizons, able to borrow or lend at the risk-free rate, an ability to short any security, and invest in fractional shares. Sharpe, William F., “Capital Asset Prices – A Theory of Market Equilibrium Under Conditions of Risk”. Journal of Finance. XIX (3), 1964, 425–42.
Rollinger, Thomas and Scott Hoffman, “Sortino Ratio: A better measure of risk.”
Futures Magazine, February 1, 2013.
A more complete analysis of large cap growth funds presented to the Plan’s Trustees can be found on GESE.org.
References
Department of Labor, Employee Retirement Income Security Act of 1974. Washington, DC, 1974.
International Association of Securities Commissions, IOSCO Research Report on Financial Technology (Fintech). London, U.K.: IOSCO. February 2017.
Investment Company Institute, 2016 Investment Company Fact Book. Washington, DC: 2016.
InvestmentNews, 2017 Adviser Technology Study. New York, NY: InvestmentNews, March 20, 2017.
Michaud, Richard O. and Robert O. Michaud, Efficient Asset Management, Second Edition. New York, NY: Oxford University Press, Inc., 2008.
Rollinger, Thomas and Scott Hoffman, “Sortino Ratio: A better measure of risk.” Futures Magazine, February 1, 2013.
Securities and Exchange Commission, Investment Advisers Act of 1040. Washington, DC, 1940.
Sharpe, William F., “Capital Asset Prices – A Theory of Market Equilibrium Under Conditions of Risk”. Journal of Finance. XIX (3), 1964, pp. 425–42.
Sironi, Paolo, FinTech Innovation. West Sussex, U.K: John Wiley & Sons Ltd. 2016
Supreme Court of the U.S., Tibble et al, v, Edison International, et al. Washington, DC: October 2014.
U.S. District Court, Central District of California, Tibble, et al v. Edison International, et al, Case 2:07-cv-05359-SVW-AGR, Document 405, Filed 07/08/10
Certification of Independence
The foregoing report is an independent evaluation of the decision-assistance process offered by Decision Technologies Corporation. It was conducted from the outset with the contractual understanding that I would be free to conduct my research and submit my findings free of external influences.
My objectives in pursuing this investigation were to 1) determine the validity of the process and its applications in identifying superior investments, and 2) evaluate its efficacy in this new regulatory, competitive, and economic environment. These objectives were accomplished by independently acquiring, examining and testing all necessary information. The result is this final report.
I herewith attest to the fact that the findings, opinions and conclusions contained in this report are my own and were arrived at independently
Sincerely,
Michael Carty
Biography
Michael Carty is principal and founder of CMC Consulting, LLC which specializes in designing active growth, growth & income, and value income strategies for separately managed accounts, pension plans, mutual funds, exchange-traded products, and long/short market neutral strategies. The firm also designs passive equity products including index and smart beta funds for licensing as ETFs. Other activities include providing expert witness testimony. He can be reached at 917-697-9464.